Faro Stats
An analytics console for visits, earnings and user behavior, shared by every sub-project on the portal.
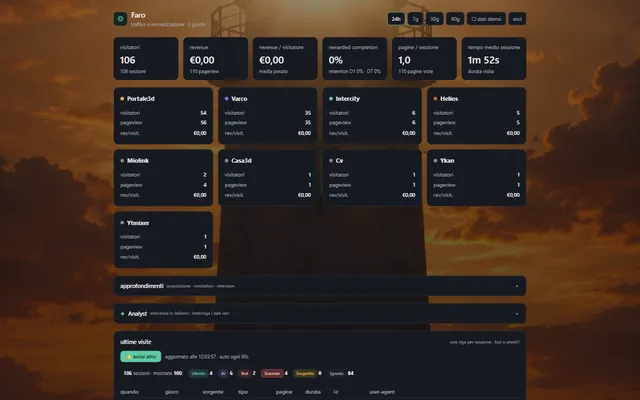
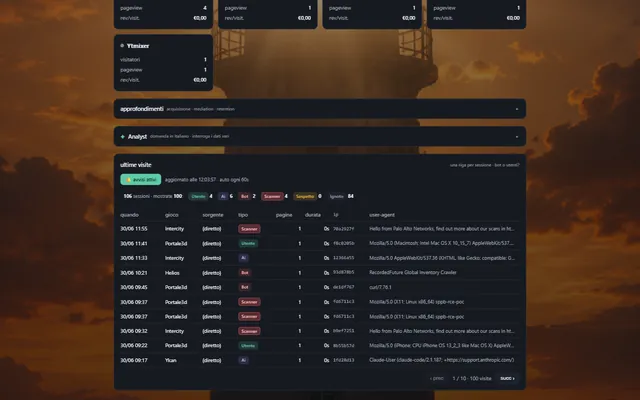
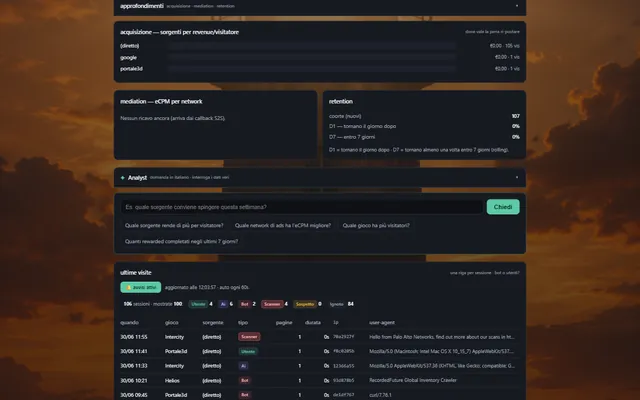
Every project hosted under portale3d.it — from games to tools to demos — generates traffic and interactions, and at first each one had its own separate dashboard. Chasing numbers scattered across ten subdomains is the surest way to never look at them. That's why Faro exists: a single in-house analytics system that gathers everything in one place, built for the whole portal ecosystem rather than one site at a time. The name isn't random — a faro is a lighthouse, the point from which you keep an eye on everything else.
Why not any analytics
The technical choice that defines Faro is server-side tracking. Most common analytics tools load a third-party script in the browser that calls a well-known external domain — and that domain is exactly the first thing every adblocker blocks. The result is that a significant slice of visits never gets counted. Faro does the opposite: a small script (track.php) is included on every page and records the event from the server, not with a call from the user's browser to a third party. There's no request to an ad domain to block, so it isn't blocked: the numbers are closer to reality.
There's a second advantage too, less technical and more a matter of principle: the data doesn't pass through an external service. It stays on the portal's server, under my control, without shipping visitors' behavior off to a third-party platform.
What it measures
- Visits and traffic sources for every connected project
- Clicks on projects and social links from the homepage, tracked as a dedicated event (
project_click): not just how many people arrive, but what they actually click on - Trends over time, to see which content works and which doesn't
- Earnings per project, to tie traffic to the result
It's not a theoretical demo: as I write, Faro has already collected over 20,000 events across nine different types (page views, game starts, ads shown and completed, project clicks and others), from June 15, 2026 to today, from thirteen connected projects — the portal homepage, the games on their subdomains and the various tools. It's the system this very site uses to measure itself, including how the first ad slots on the games perform.
Human or bot? Filters in a row
A visit counter is worth little if it also counts robots. Half of Faro's work, really, is keeping non-human traffic out, and it does so with three checks in sequence.
The browser signature. Every visit shows up with a string declaring who it is: «Chrome on Windows», «Googlebot», and so on. Faro reads it and classifies: real browser, search-engine crawler, AI agent (the various GPTBot, ClaudeBot, Perplexity that read the web on behalf of AIs), security scanners probing the site for holes, or «suspicious» when it's neither a browser nor a recognized bot. Anything that isn't a real browser is flagged as a bot the moment the event is written, once: so every later count can simply ignore it, without redoing the work.
Behavior. Some bots lie and declare themselves «Chrome» while not being it. Against those Faro looks at how they browse: if from a single address — kept only in encrypted form — many different «visitors» arrive who open one page, run no script and vanish, that is something cycling identities to avoid being recognized. Only those ghost visits are flagged, never the whole address, so a real user who drops by once and leaves isn't touched.
The absence of JavaScript. A visit that loads one page and never sends a single signal from the browser, with the session already closed for half an hour, is almost certainly a program faking a browser but not running code. That one ends up among the bots too.
The practical effect: out of over 20,000 events collected, about 6,000 have already been recognized as non-human and removed from the «real» numbers. There's also a list of addresses to always exclude — mine, the one at home — so my own check-up visits don't pollute the stats.
What went wrong
Faro started minimal and grew by additions, and a couple of times that meant a number wasn't measuring exactly what it seemed to. Before bot classification existed, crawlers ended up inside the «visitors» and inflated the totals; before the behavior checks, bots faking a browser got through anyway. Each time the fix was the same: add a filter and reclassify, not rewrite history — the new structures create themselves on first pass and the old events stay where they are, re-read with the updated rules. It's the price of a tool that adapts while you use it, instead of waiting for the «definitive» version.
How it works
A small JavaScript SDK (faro/sdk.js) is included on every page of the portal and sends events to a collection endpoint (collect.php); a PHP dashboard aggregates them and presents them in readable form. On top of the raw numbers there's an AI-assisted summary layer: a model (gpt-oss served via Groq, routed through a Cloudflare worker because the hosting blocks the direct call) reads the window's metrics and writes two or three lines at the top of the report — what rose, what fell, an alert if something worsens and a concrete «Action». It isn't a process that runs on its own: it fires when the briefing is needed — every morning via cron, or on demand — and summarizes the data at that moment.
New today: organic search
Until yesterday Faro knew how many visits and from which tagged link (for example ?src=reddit), but all the traffic coming from a Google search fell into a single «(direct)» block, blind. As of today Faro also reads Google Search Console: which keywords bring impressions and clicks, the average ranking position, and above all the queries one step from the first page — those in position 5-20, where a small tweak can move the site up. It's a separate dataset, aggregated and with no individual visitor identity, that sits alongside the events but doesn't add to them.
Why build it in-house
An analytics tool built on your own will never compete with the industry giants on breadth of features. But for an ecosystem of projects like this one it has three advantages that matter more: it counts the visits the others lose, it keeps the data at home, and it's simple enough to adapt — a new event, a different metric, one more anti-bot filter — the moment you need it, without depending on someone else's release schedule.